I built geojson.app, an open source web mapping stack
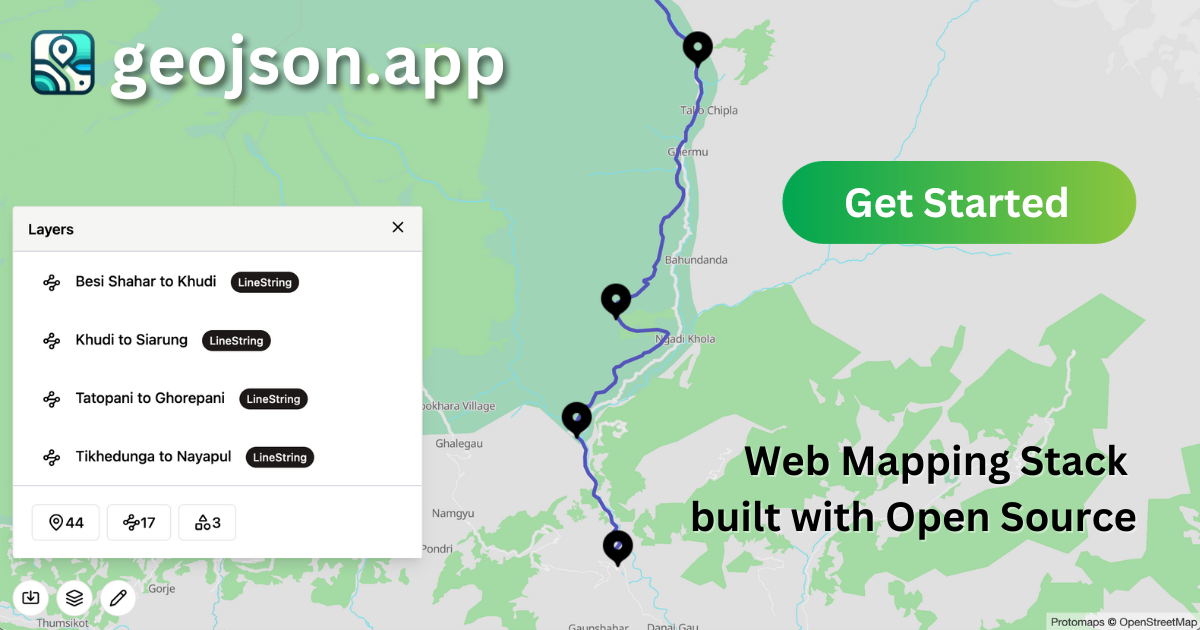
Building your own web mapping stack may feel like starting a cow farm just to have some ice-cream, but let me show you why you should consider it anyway.
From a humble street map embedded on an events page to a geolocation information-centric product like Uber, Strava, or Airbnb, web mapping is the transformative technology powering these experiences. According to Allied Market Research, the digital mapping industry was valued at over USD 20B in 2022 and is expected to grow at a CAGR of 15.4% in the next decade. In the context of web mapping, Here Maps, Google Maps, TomTom, and Mapbox are incumbent providers of core features like base map layers, search, geocoding, and mapping libraries. However, these incumbents leave a lot to be desired.
Using an existing solution
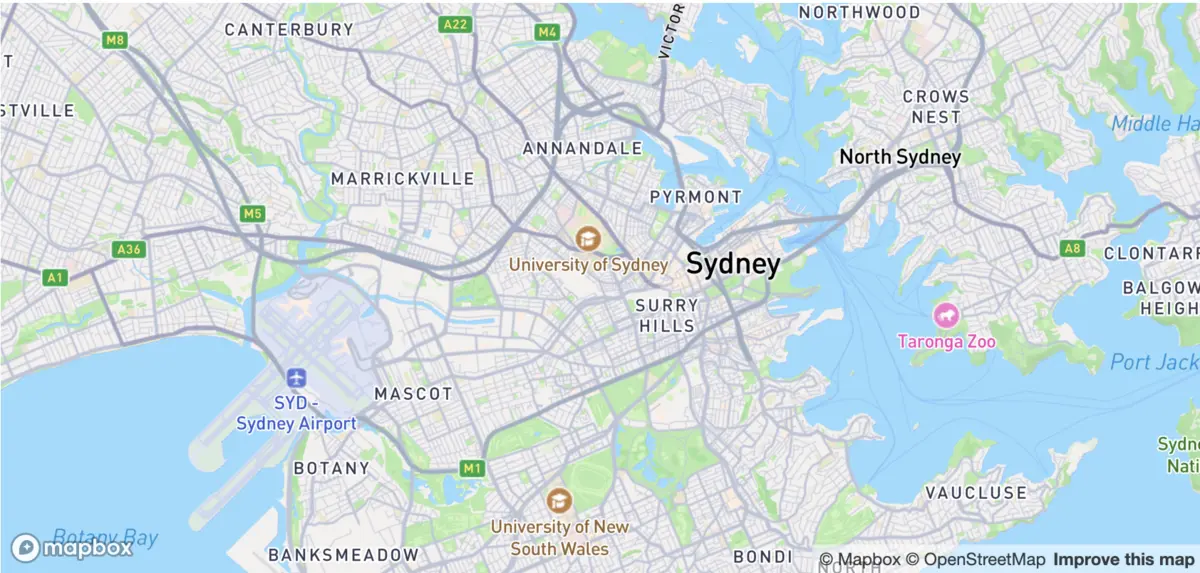
As builders, the majority of us have little to no exposure to web mapping. After all, most products have little to no need for web mapping. However, getting started with web mapping is fairly simple. Here is an example of an interactive map of Sydney using the Mapbox GL JS library.
<html>
  <head>
    <link href="https://api.mapbox.com/mapbox-gl-js/v3.1.2/mapbox-gl.css" rel="stylesheet">
    <script src="https://api.mapbox.com/mapbox-gl-js/v3.1.2/mapbox-gl.js"></script>
    <style>
      body { margin: 0; padding: 0; }
      #map { position: absolute; top: 0; bottom: 0; width: 100%; }
  </style>
  </head>
  <body>
    <div id="map"></div>
    <script>
      mapboxgl.accessToken = 'YOUR_MAPBOX_ACCESS_TOKEN';
      const map = new mapboxgl.Map({
      container: 'map', // container ID
      center: [-74.5, 40], // starting position [lng, lat]
      zoom: 9 // starting zoom
      });
    </script>
  </body>
</html>
Other incumbents offer similar clean APIs for building products powered by web mapping. You may have noticed that you need a mapboxgl.accessToken to use Mapbox. Similarly, other incumbents also require setting up an access token, which involves signing up and providing your payment details. Once you have done that, you should be able to add an interactive map to your website easily.
Usage and Pricing
The access token that we discueed earlier, is used to authenticate Mapbox, and track your usage. Usually, most providers have a free tier, which seems generous.For instance, for Mapbox, 50K map loads a month are free using their Mapbox GL JS library. While 50K page loads is plently for most personal blog, or portfolios, it is barely enough for a product with real usage.
Consider an event page with an embedded map that received 1M page views in a month. 1M page views might sound like a lot, but a trending post on X (aka Twitter), Hacker News, or Reddit can quickly get you there. With some back-of-the-envelope math, Mapbox’s usage costs alone would be over US$3000. Keep in mind that this is the most basic use case of web mapping, merely rendering a map with a street view that is not generally interacted with. The costs can easily balloon as you use their Navigation, Search, and other features to build something more complex.
What if I told you that you could build your own open-source web mapping stack that would cost you two orders of magnitude less than the incumbents? With 1M page views a month, it would cost you less than US$20.
Building an open source web mapping stack
Building your own open-source web mapping stack might seem like starting a cow farm just for some ice cream. However, beyond the ability to create geolocation information-centric products at a fraction of the cost, there are numerous other compelling reasons why builders should consider this route. I will delve into some of these reasons below.
My experience with web mapping
Over the past 5 years, I’ve gained extensive experience in web mapping. Initially, at Deakin University, I was part of the team responsible for developing Deakin Scout, an award winning, indoor wayfinding platform for kiosks and mobille. Following that, at Sensand, I led the team that created Blockbase, a Geospatial data aggregation platform for land management. These solutions were built using Google Maps and Mapbox , respectively.
Enter MapLibre
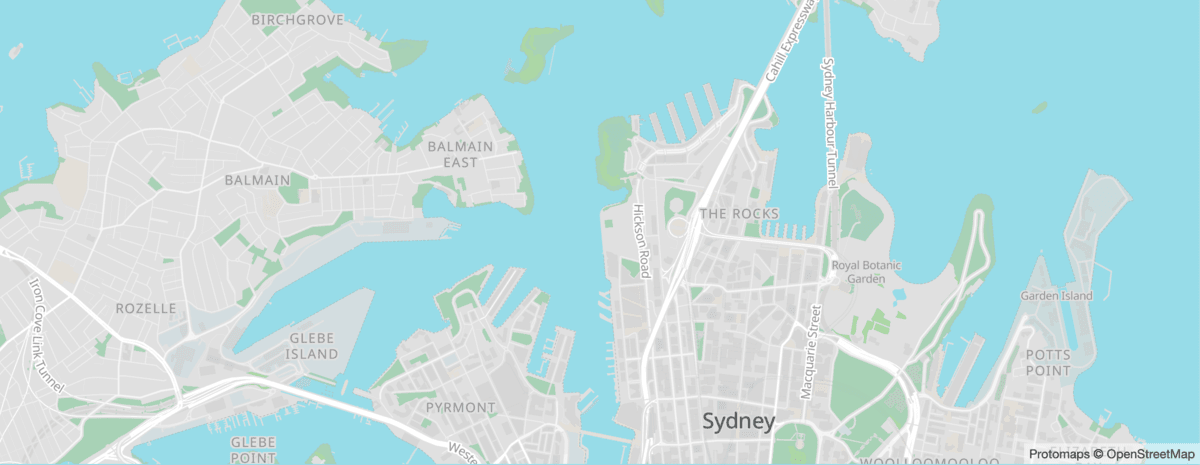
MapLibre organization is an umbrella for open-source mapping libraries. They build and maintain libraries, utilities, and specifications for digital mapping. Mapbox GL JS is an open-source typescript library for publishing maps on your website. It offers fluid and performant maps using GPU acceleration and vector tile rendering. Here is an example of using MapLibre GL JS to render an equivalent map as we saw above.
<html>
  <head>
    <link href='https://unpkg.com/maplibre-gl@latest/dist/maplibre-gl.css' rel='stylesheet' />
    <script src='https://unpkg.com/maplibre-gl@latest/dist/maplibre-gl.js'></script>
    <style>
      body { margin: 0; padding: 0; }
      #map { position: absolute; top: 0; bottom: 0; width: 100%; }
  </style>
  </head>
  <body>
    <div id="map"></div>
    <script>
      var map = new maplibregl.Map({
        container: 'map',
        style: 'https://demotiles.maplibre.org/style.json', // stylesheet location
        center: [-74.5, 40],
        zoom: 9
      });
    </script>
  </body>
</html>
The style property specified in MapLibre map defines the source of vector tiles, and style used to render it. If you dont know what vector tiles, or styles are, we will dive deep into these concepts later. Here is a screenshot of a MapLibre map.
Vector Tiles
Maps on the web are delivered in fragments called tiles. This concept was introduced by Google Maps, and is used by all incumbants on the industry. There are a set of tiles for each zoom level that multiply when you zoom in. The mapping library responds to the user interaction and fetches the right tile at the right zoom level.
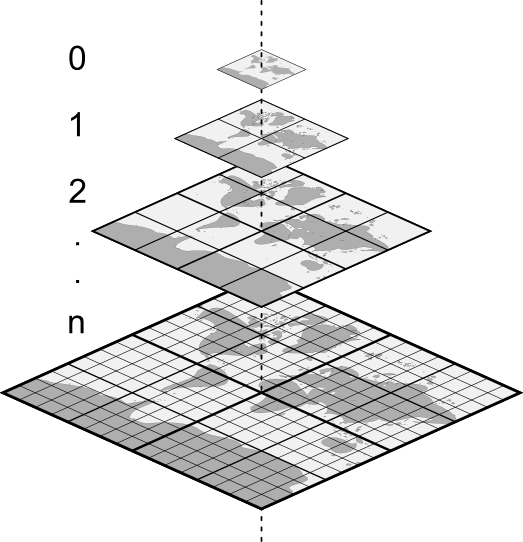
A conceptual tileset from Planet
Historically, each of these tiles used to be pre-rendered static images like jpg or png. Howver, modern maps use vector data format to deliver tile data. URL to fetch a vector tile from a server is usually formatted as such https://tiles.geojson.app/street-map/{Z}/{X}/{Y}.<ext>. Your web mapping library ensures that each time the viewport of the map changes, new tiles are fetched from the server. One popular vector tile format is mvt, which is a open specification for vector tiles encoded as Google Protobufs. This ensures each of the tiles can be delivered over the network efficiently.
Sourcing Vector Tiles
Where do I source my own Vector tiles, I hear you ask. Let me introduce you to OpenStreetMap. OpenStreetMap is a map of the world, created by people like you and free to use under an open license. You can create vector tiles using Open Source GIS utilities like Tippecanoe, or GDAL. Once you have your vector tiles, you have to host them, so they are available to clients for consumption. Before we discuss how do we host it, lets get a better understanding of how many tiles do we have to manage to understand the size of the problem.
To provide a comprehensive coverage of the entire world up to zoom level 15(4.77m/pixel at equator), we need to manage around 1.43 billion vector tiles. This figure emerges from the fact that each increase in zoom level quadruples the number of tiles. Starting from a single tile at zoom level 0, the number grows exponentially with each subsequent level. This understanding is pivotal for anyone venturing into the domain of building their own web mapping solutions. With the sheer number of tiles, just uploading them to cloud storage will incur thousands of dollars in only operation charges. This is in addition to any storage, and egress charges.
Protomaps
“Protomaps is the single most exciting development in digital mapping in the past 10 years.”
Protomaps is an open source system for interactive web maps. Protomaps is designed around static, read-only datasets that are deployed by simply copying large files to S3 or any compatible storage platform. More demanding use cases can use a content delivery network based on AWS Lambda or Cloudflare Workers. A core technology behind Protomaps is PMTiles. PMTiles is a single-file archive format for pyramids of tiled data. A PMTiles archive can be hosted on a storage platform like S3, and enables low-cost, zero-maintenance map applications. Protomaps offer and recommend Cloudflare integration. Uploading your PMTiles to Cloudflare R2 and setting up the routes is fairly straighforward. Cloudflare R2 does not have associated egress costs, which means that your map tiles are delivered with a edge CDN and infinitely scalable to traffic surges. This ensures your map tiles are not only cost-efficient but also scale seamlessly with traffic spikes, a crucial aspect for applications expecting high user engagement. Furthermore, the zero-maintenance aspect of Protomaps, underscored by its static, read-only data paradigm, makes it an attractive option for developers looking to build robust, scalable map applications without the overhead of complex infrastructure management. This aligns perfectly with the needs of developers seeking to deliver high-quality mapping experiences with minimal operational hassle.
GeoJSON
GeoJSON is a widely used format for encoding geographic data structures, including points, lines, and polygons, in JSON. It’s particularly favored for its simplicity and compatibility with web standards. When working with MapLibre, GeoJSON becomes a powerful tool. MapLibre can effortlessly render GeoJSON data, enabling the creation of dynamic and interactive maps. By simply adding a GeoJSON source to a MapLibre map, developers can overlay a wide range of geographical features, from simple markers to complex shapes, enhancing the user’s spatial understanding and interaction with the map. This combination of GeoJSON and MapLibre opens up endless possibilities for web mapping applications, from visualizing data points to crafting rich, interactive geospatial experiences.
Conclusion
It is clear that web mapping is more than just an overlay on a webpage; it’s a gateway to myriad applications and experiences. The evolution from static image tiles to dynamic vector tiles, and the integration of GeoJSON with powerful libraries like MapLibre, and Protomaps, signifies a leap in how we interact with geospatial data. Protomaps is a testament to the innovation in this space, offering an efficient, cost-effective solution that caters to the demands of modern web applications.
My journey from digital products using incumbent APIs for web mapping to deploying a sophisticated, open-source web mapping stack demonstrates the incredible potential and flexibility available to developers today. Whether it’s for an event page or a complex geolocation-centric product, the tools and technologies at our disposal empower us to create rich, engaging, and scalable map experiences without being locked in with a incumbant. This field, burgeoning with opportunities, is not just for seasoned geospatial professionals but also for any developer who cares to dive into the fascinating world of web mapping.